
911 Project: Accident Analysis and Prediction
Background
All day, most every person gets behind the wheel of their car—a dangerous act that has been deemed necessary to live and work. Unpredictable drivers, traffic patterns, weather, and roadway hazards can create dangerous driving conditions any time we’re on the road.
Motor vehicle crashes are the leading cause of death among those under age 55 in the US. [1]
Tennessee had the following total accidents [2]:
- 2015 - 197,203
- 2016 - 206,409
- 2017 - 208,246
- 2018 - 208,605
The frequency of accidents is trending in the wrong direction. The CUIPs team of researchers wants to reverse the trend. We have the technology and data to positively impact the health and safety of our roadways, so we are seeking to learn how we can make Hamilton County drivers safer for everyone.
Our question became: How can these dangers be prevented or have their effects reduced?
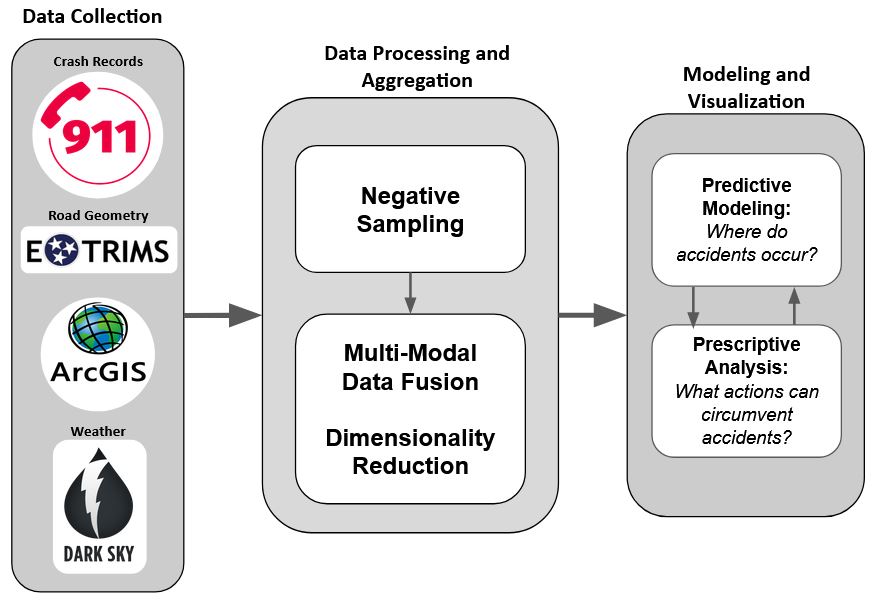
Using historical 911 emergency call data, the CUIP is building a predictive model for roadway accidents. Historical and real-time 911 data, combined with weather and roadway geometric data, are used by these models so that the CUIP can help the Chattanooga Police Department best allocate officers and resources to high-probability areas. Identifying areas and conditions likely to result in roadway accidents and turning those insights into action leads to reduced response times, a reduction in accidents, and a safer Chattanooga.
Visualization
Explore the model below to see our work. The darker the color and taller the gridblock tower, the more accidents that take place in that area. Use the slides on the right to explore accident trends by the hour, starting at midnight. Hours are in military time.
Technical Details
The CUIP studies current and historical 911 data to identify accident trends and cross-references this data with weather, roadway geometric data, accident time and date, and the accident’s latitude and longitude. This dataset is placed within a virtual grid of Chattanooga—where one gridblock roughly represents a 2x2 square of city blocks—and accident conditions and locations are identified as “hotspots” for accidents.

The City of Chattanooga is depicted in the image {direction}, divided into 694 equally sized hexagons, each measuring .2 square miles, or roughly the size of 2 city blocks. Dividing the city into smaller areas allows for historical analysis of accident ‘hotspots’, as well as simplifying modeling for future accident prediction.
This dataset serves as the bedrock for a CUIP neural network model that aims to predict where accidents will be in the future based on certain conditions—the ultimate goal of the project. Predicting where, when, and the conditions that foster roadway accidents gives the city of Chattanooga targeted insight into where to allocate officers, speed deterrents, or how roadways can best be restructured to mitigate the frequency of accidents.
In the future, we anticipate that first responders and citizens stand to gain from this data as well, making informed decisions about choosing a destination route, avoiding accident-prone areas and reducing accident probability for themselves and others.
This project utilizes machine learning, specifically multilayer perceptron (MLP) neural network models. Accident data is sent to the CUIP every morning by Hamilton County Emergency Services, with weather data being pulled from DarkSky. Roadway geometrics are provided by ETRIMS, the Tennessee Department of Transportation’s online database of roadway data. This data includes number of lanes, the type of roadway surface, and the land use around the roadway.
Analysis
Weekday and Hour
The division of accidents among the days of the week and hours of the day is presented by the image to the right. Days included in the traditional workweek follow a certain trend, with accidents rising to a peak within 7 - 8 a.m., then falling during the lunchtime hours. Then, the start of another upward trend beginning shortly afterward, culminating in the evening rush hours. After the evening rush, accidents again decline to their overnight lows. The highest occurrence of accidents within any given hour is 4 p.m. on Fridays at 1,402 accidents over the three-year period, followed closely by 1,389 accidents for 5 p.m. on Thursdays throughout the same timeframe.

Weekends present an entirely different trend. Early morning hours for Saturday and Sunday involve a higher number of accidents than the workweek. Then, accident occurrences build slower throughout the day, reaching their highest around noon on Saturdays, and 1 p.m. on Sundays. This peak also persists longer than the workweek trend, slowly declining throughout the remainder of the day.
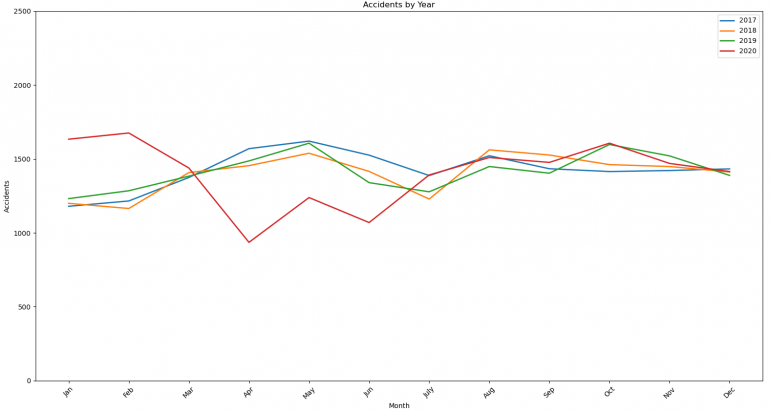
Year and Month
The division of accidents for the three years of study divided into months can be seen in the image below. All three years follow the same rough trends, fluctuating higher or lower within varying margins. January begins the year with the least number of accidents for two of the three years, with February staying roughly the same for 2017 and 2019, while 2018 experienced a slight decline in accident occurrence during the month. Accident counts across all three years increase significantly in March and continue to climb until May. All three years once again follow the same trend, falling to the June accident counts. Note that while 2017 and 2019 experienced a significant drop in accident occurrences, 2018 did not decline as rapidly. The decline in occurrence persists into July, before once again rising in August. Summertime decline could be contributed to children not attending classes. After the increase of August, accidents decline to some degree for all three years for September. October begins an interesting development for 2019, as a noteworthy increase of accidents begins. While 2017 and 2018 both demonstrate a slight increase for October, followed by a slight decrease into November and December, 2019 continues to increase.
Read More
Citation: J. Roland, P. Way, M. Sartipi, “Studying the Effects of Weather and Roadway Geometrics on Daily Accident Occurrence using a Multilayer Perceptron Model,” SCOPE ‘19 Proc. of the Fourth Workshop on International Science of Smart City Operations and Platforms Engineering