Alternative Fuels
The following links will jump to the section with more information on their respective subject.
- U.S. Daily Oil Demand
- Electricity Cost Less
- Reducing Air Pollution
- Perfect Combustion
- Pollution in the U.S.A.
- Areas Below Clean Air Standards
- 6 Criteria Air Pollutants Targeted by the EPA
By reducing the amount of internal combustion engine (ICE) vehicles, we also reduce our dependence on the unstable Middle East for the tremendous amount of oil we currently import and consume. The US economy continues to maintain a staggering trade imbalance. The importation of foreign crude oil is responsible for a large part of that imbalance. The use of alternative fuels, specifically electricity, allows more dollars to remain in our economy. Oil imports represented about 43% of total U.S. oil consumption in 1993 and have increased to around 46% today while still rapidly rising. Given current policies and trends, U.S. oil imports are projected to cost over $100 billion per year within ten years, considering only direct purchase costs. Oil imports cost the United States significantly more when indirect costs such as foregone jobs, loss of GDP, national defense, and environmental damage are taken into account. The United States could greatly reduce its oil imports during the next twenty years by increasing energy efficiency and accelerating the introduction of fuels derived from renewable energy sources, particularly in the transport sector. The graph shown below illustrates the continual rise in U.S. oil importation over the last 25 years.
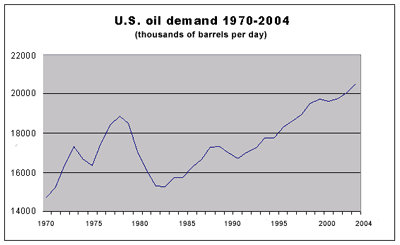
With world oil prices low and expected to stay that way for some time, the outlook for the United States is for continuing increases in demand for petroleum products and decreases in crude oil production. Oil provides about 40% of all U.S. energy. Imports of crude oil and petroleum products (about 8 million barrels per day, bpd) supply about 46% of U.S. oil consumption of about 18.8 million bpd. Some 65% of oil consumption (about 11 million bpd) goes to products used in the transportation sector (gasoline, diesel fuel, jet fuel); the sector is about 95% dependent on oil products. In 1994, gasoline consumption was about 7.6 million bpd (117 billion gallons), about two-thirds of the total petroleum fuel consumption. Of the 7.6 million bpd of gasoline consumption, two-thirds, or about 5 million barrels per day, were burned by automobiles (most of the rest was consumed by light trucks). About 21 billion gallons (1.4 million bpd) of diesel fuel for highway use was consumed, and about 23 billion gallons (1.5 million bpd) of jet fuel was used.
Gasoline consumption is just about equal to crude oil imports today (7.6 million bpd vs. 7.0 million bpd). Although it is not physically the case that oil imports go directly to auto and truck travel (about 65% of the oil going into a refinery comes out as gasoline and diesel fuel), from an overall material balance perspective, just about every barrel of oil imported can be thought of as going directly into gasoline for automobile and truck driving.
Energy cost is another area where it is possible to reap economic benefits by utilizing electric vehicles. The fuel cost of driving an electric vehicle depends on the cost of electricity per kWh and the efficiency of the vehicle. To determine the cost per mile of an electric vehicle using the graph below, select the location on the left axis (Electricity Cost per kWh) at 7 cents in the graph below. Draw a horizontal line to the right until you bisect the EV 3 mi/kWh line. Next draw a vertical line down until you intersect the bottom axis(Energy Cost per mile). This indicates that the fuel for an electric vehicle with an energy efficiency of 3 mi/kWh cost about 2.3 cents per mile when electricity cost 7 cents per kWh.
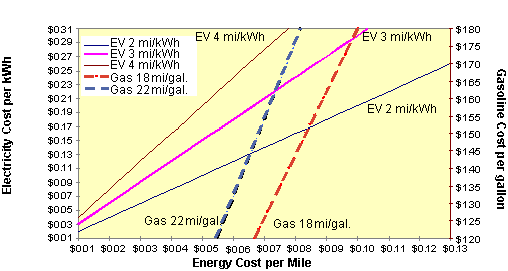
Currently, the national average cost for electricity is about 6.8 cents per kWh, while the average residential rate is around 8.5 cents per kWh. Some electric utility companies have special rates in place that are cheaper at night when the demand for electricity is low. These rates can be as low as 3 cents per kWh. Older electric vehicles in commercial fleets have energy efficiencies of about 2 mi/kWh while new electric vehicles such as GM's EV1 have energy efficiencies of over 6 miles per kWh. Heavy-duty vehicles such as trucks and buses average about 1 mile per kWh.
To determine the energy cost per mile of a gasoline vehicle, pick the location on the right axis(Gasoline Cost per gallon) and $1.35. Draw a horizontal line to the left until you intersect the Gas 18 mi/gal line. Now draw a vertical line down until you intersect the bottom axis(Energy Cost per mile). This indicates the fuel for a gasoline vehicle with an energy efficiency of 18 mi/gal costs around 7.5 cents per mile when gasoline costs $1.35 per gallon.
This indicates that even an older less energy efficient electric vehicle(2 mi/kWh) at the national average of 7 cents per kWh, is cheaper to operate at 4 cents per mile than the more efficient(Gas 22 mi/gal) vehicle operating with the national average of $1.25 per gallon at over 7 cents per mile.
Reducing Air Pollution
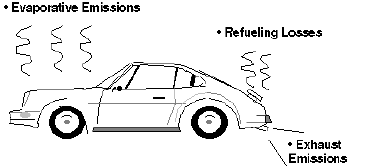
Emissions from an individual car are generally low, relative to the smokestack image many people associate with air pollution. But in numerous cities across the country, the personal automobile is the single greatest polluter, as emissions from millions of vehicles on the road add up. Driving a private car is probably a typical citizen's most "polluting" daily activity.
The power to move a car comes from burning fuel in an engine. Pollution from cars comes from by-products of this combustion process (exhaust) and from evaporation of the fuel itself.
Gasoline and diesel fuels are mixtures of hydrocarbons, compounds which contain hydrogen and carbon atoms. In a "perfect" engine, oxygen in the air would convert all the hydrogen in the fuel to water and all the carbon in the fuel to carbon dioxide. Nitrogen in the air would remain unaffected. In reality, the combustion process cannot be "perfect," and automotive engines emit several types of pollutants.
"Perfect" Combustion:
FUEL (hydrocarbons) + AIR (oxygen and nitrogen) ==>>
CARBON DIOXIDE + water + unaffected nitrogen
Typical Engine Combustion:
FUEL + AIR ==>> UNBURNED HYDROCARBONS + NITROGEN OXIDES
+ CARBON MONOXIDE + CARBON DIOXIDE + water
Transportation sources are one of the leading contributors to hazardous air pollutants. The internal combustion engine emits a large percentage of pollutants, but gasoline and diesel in the liquid form also contribute chemical pollution in the form of vaporization of the fuel as it heats and cools within the gas tank.
There are over 100 HAP's, including many chemicals that are associated with cancer, neurological, respiratory, reproductive and developmental effects as well as other adverse effects on your health. Using data gathered from the U.S. EPA and extensive modeling, the Environmental Defense Fund has presented a screening-level characterization of the cancer and non cancer risks posed by hazardous air pollutants by state as shown below.
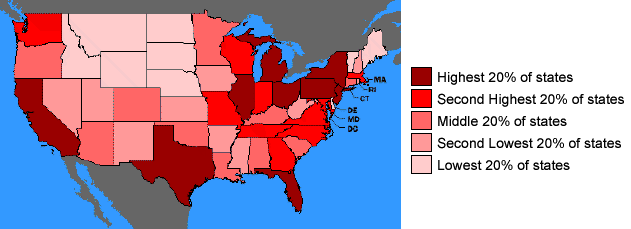
Map of people living in areas where the estimated cancer risk from Hazardous Air Pollutants(HAP) is greater than 1 in 10,000
Since the passage of the 1970 Clean Air Act, there has been substantial progress in reducing the emission of all but one of the six criteria air pollutants targeted by the EPA in the Clean Air Act. Many urban areas still experience days when air is unhealthy to breathe, and reduction in emissions, by using alternative energy sources, is the only solution as the number of the vehicles on the road will only continue to increase.
Criteria air pollutants are common throughout the United States. These pollutants can injure health, harm the environment and cause property damage. U.S. EPA has identified six criteria pollutants:
Carbon Monoxide
Lead
Nitrogen Dioxide (one of several Nitrogen Oxides)
Ozone (formed from precursor Volatile Organic Compounds)
Particulate Matter
Sulfur Dioxide
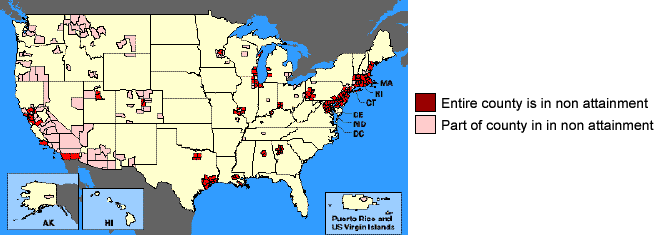
EPA has established National Ambient Air Quality Standards (NAAQS) for each criteria pollutant, which defines the maximum legally allowable concentration. If the NAAQS for a pollutant is exceeded, adverse effects on human health may occur. EPA and state agencies monitor area quality to assess compliance with these standards. Areas of the country where air pollution levels persistently exceed the standards may be designated by the U.S. EPA as non-attainment areas. The map shown below lists areas of only partial or total non-attainment of the 1970 Clean Air Act.
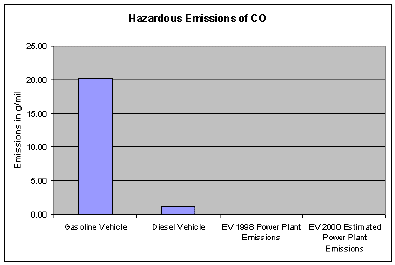
Carbon monoxide (CO) is a colorless, odorless and poisonous gas produced by incomplete burning of carbon in fuels. When CO enters the bloodstream, it reduces the delivery of oxygen to the body's organs and tissues. Health threats are most serious for those who suffer from cardiovascular disease. Exposure to elevated CO levels can cause impairment of visual perception, manual dexterity, learning ability and performance of complex tasks.
77% of the nationwide CO emissions are from transportation sources. The largest emissions contribution comes from highway motor vehicles. Thus, the focus of CO monitoring has been at traffic-oriented sites in urban areas where the main source of CO is motor vehicle exhaust.
NAAQS: 9 ppm (8-hr average) and 35 ppm (1-hr average)
LEAD (Pb)
Lead (Pb) is a widely used metal that, once released to the environment, can contaminate air, food, water, or soil. Exposures to even small amounts of lead over a long time can accumulate to reach harmful levels. Harmful effects may therefore develop gradually without warning. Short-term exposure to high levels of lead may also cause harm. Lead can adversely affect the nervous, reproductive, digestive, cardiovascular blood-forming systems, and the kidney. In men, adverse reproductive effects include reduced sperm count and abnormal sperm. In women, adverse reproductive effects include reduced fertility, still-birth, or miscarriage. Children are a sensitive population as they absorb lead more readily and their developing nervous system puts them at increased risk for lead-related harm, including learning disabilities.
Lead gasoline additives, non-ferrous smelters, and battery plants are the most significant contributors to Pb emissions into the atmosphere. In 1993 transportation sources contributed 33% of the annual emissions, down substantially from 81% in 1985. Total Pb emissions from all sources dropped from 20,100 tons in 1985 to 4,900 tons in 1993. The decrease in Pb emissions from cars and trucks shifting to lead-free gasoline accounts for essentially all of this decline.
NAAQS: 1.5 ug/m3 (quarterly average)
NITROGEN DIOXIDE (NO2)
Nitrogen dioxide (NO2) is a brownish, highly reactive gas that is present in all urban atmospheres. NO2 can irritate the lungs, cause bronchitis and pneumonia, and lower resistance to respiratory infections.
The major mechanism for the formation of NO2 in the atmosphere is the oxidation of nitric oxide (NO), which is produced by most combustion processes.
NAAQS: 0.053 ppm (annual mean)
NITROGEN OXIDES (NOx)
Nitrogen oxides (NOx) include various nitrogen compounds like nitrogen dioxide (NO2) and nitric oxide (NO). These compounds play an important role in the atmospheric reactions that create ozone (O3) and acid rain. Individually, they may affect ecosystems, both on land and in water.
NOx forms when fuels are burned at high temperatures. The two major emissions sources are transportation vehicles and stationary combustion sources such as electric utility and industrial boilers.
OZONE (O3)
Ozone (O3) is the major component of smog. Although O3 in the upper atmosphere is beneficial because it shields the earth from the sun's harmful ultraviolet radiation, high concentrations of O3 at ground level are a major health and environmental concern. The reactivity of O3 causes health problems because it damages lung tissue, reduces lung function and sensitizes the lungs to other irritants. Scientific evidence indicates that ambient levels of O3 not only affect people with impaired respiratory systems, such as asthmatics, but healthy adults and children as well. Exposure to O3 for several hours at relatively low concentrations has been found to significantly reduce lung function and induce respiratory inflammation in normal, healthy people during exercise.
O3 is not usually emitted directly but is formed through complex chemical reactions in the atmosphere. Precursor compounds like volatile organic compounds (VOC) and oxides of nitrogen (NOx) react to form O3 in the presence of sunlight. These reactions are stimulated by ultraviolet radiation and temperature, so peak O3 levels typically occur during the warmer times of the day and year.
NAAQS: 0.12 ppm (1-hr average) and 0.08 ppm (8-hr average)
PARTICULATE MATTER (PM)
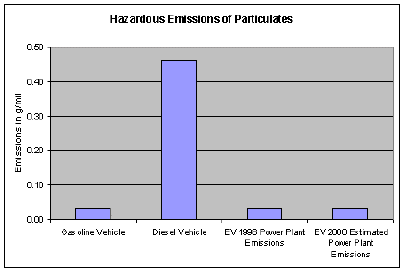
Particulate matter (PM) is a mixture of particles that can adversely effect human health, damage materials and form atmospheric haze that degrades visibility. PM is usually divided up into different classes based on size, ranging from total suspended matter (TSP) to PM-10 (particles less than 10 microns in aerodynamic diameter) to PM-2.5 (particles less than 2.5 microns). In general, the smallest particles pose the highest human health risks. PM exposure can affect breathing, aggravate existing respiratory and cardiovascular disease, alter the body's defense systems against foreign materials, and damage lung tissue, contributing to cancer and premature death. Individuals with chronic obstructive pulmonary or cardiovascular disease, asthmatics, the elderly and children are most sensitive to the effects of PM.
Particulate matter (PM) includes dust, dirt, soot, smoke and liquid droplets directly emitted into the air by sources such as factories, power plants, cars, construction activity, fires and natural windblown dust. Particles formed in the atmosphere by condensation or the transformation of emitted gases such as SO2 and VOCs are also considered particulate matter.
PM10 NAAQS: 50 ug/m3 (annual mean) and 150 ug/m3 (24-hr average)
PM2.5 NAAQS: 15 ug/m3 (annual mean) and 65 ug/m3 (24-hr average)
SULFUR DIOXIDE (SO2)
High concentrations of sulfur dioxide (SO2) affect breathing and may aggravate existing respiratory and cardiovascular disease. Sensitive populations include asthmatics, individuals with bronchitis or emphysema, children and the elderly. SO2 is also a primary contributor to acid rain, which causes acidification of lakes and streams and can damage trees, crops, historic buildings and statues. In addition, sulfur compounds in the air contribute to visibility impairment in large parts of the country. This is especially noticeable in national parks.
Sulfur dioxide (SO2) is released primarily from burning fuels that contains sulfur (like coal, oil and diesel fuel). Stationary sources such as coal- and oil-fired power plants, steel mills, refineries, pulp and paper mills, and nonferrous smelters are the largest releasers.
NAAQS: 0.03 ppm (annual mean), 0.14 ppm (24-hr average) and 0.50 ppm (3-hr average)
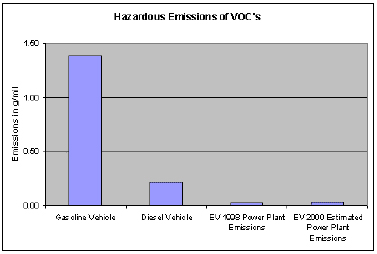
VOLATILE ORGANIC COMPOUNDS (VOC)
Volatile organic compounds (VOC) are defined by the Clean Air Act as chemicals that participate in forming ozone (O3). Ozone is a respiratory toxicant. The class of VOCs includes many specific chemicals which may also cause adverse health effects in their own right (such as cancer or reproductive toxicity).
VOCs are emitted from diverse sources, including automobiles, chemical manufacturing facilities, dry cleaners, paint shops and other commercial and residential sources that use solvent and paint. VOC emissions form O3 through complex chemical reactions with oxides of nitrogen (NOx) in the presence of sunlight.
In addition to pollutants normally associated with exhaust, ICE's further harm our environment with evaporative emissions (which are emissions that are caused by using a liquid fuel) which include fuel in the fuel tank, the fuel lines and unburned fuel from the combustion process. We all have had personal contact with evaporative emissions whenever we fuel our automobile or truck at a gas station.
Hydrocarbon pollutants escape into the air through fuel evaporation. With today's efficient exhaust emission controls and gasoline formulations, evaporative losses can account for a majority of the total hydrocarbon pollution from current model cars on hot days when ozone levels are highest. Evaporative emissions occur several ways:
- DIURNAL: Gasoline evaporation increases as the temperature rises during the day, heating the fuel tank and venting gasoline vapors.
- RUNNING LOSSES: The hot engine and exhaust system can vaporize gasoline when the car is running.
- HOT SOAK: The engine remains hot for a period of time after the car is turned off, and gasoline evaporation continues when the car is parked.
- REFUELING: Gasoline vapors are always present in fuel tanks. These vapors are forced out when the tank is filled with liquid fuel.
As indicated by the chart above, EV's still produce lower emissions in most categories than do conventional internal combustion engines even when the power plant emissions are accounted for.