
UTC's Voting History
Skip sidebar navigation
UTC media
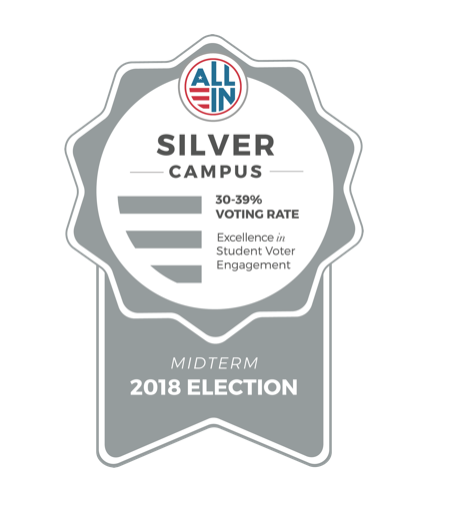
Silver Campus
For our 2018 efforts in “Excellence in Student Voter Engagement,” UTC was designated a Silver Campus by the All In Campus Democracy Challenge.
Data courtesy of NSLVE (National Study of Learning, Voting, and Engagement)
2016 Presidential Election
- Only 70.8% of UTC students were registered, and 40.6% voted in 2016.
- This was a decrease of almost three percentage points in both categories from 2012.
- Approximately 46% of students cast a ballot during the early voting period; while 43% voted on Election Day, and 10% voted absentee.
- Voter turnout was lowest among Freshmen (29%) and Sophomores (36%), compared to upperclassmen (43%).
- By age group, 35% of students between 18-21 voted, compared to 40% of their peers between the ages of 22-24, and 48% of those who are between 25 and 29 years old.
- By gender, eligible female voter turnout topped male turnout by approximately 5 percentage points -- 55% for females versus 50% for males.
- By major, the highest turnout rates were seen in fields of study classified as Legal Studies (54%), History (53.9%), Public Administration (53.6%), and the Social Sciences (53.1%).
- The lowest turnout rates were among majors classified as: Physical Sciences (29.5%); Parks, Recreation, Leisure, and Fitness Studies (31.5%); and Liberal Arts and Humanities (34%).
2018 Midterm Election
- Compared to 2016, voter registration among UTC students increased by nearly 3 percentage points (73.6% in 2018 versus 70.8% in 2016).
- Turnout among students more than doubled compared to the 2014 midterm elections. Over 35% percent of students voted in 2018 compared to only 13% in 2014.
- Compared to 2016, more students chose to vote on Election Day as opposed to voting early or absentee. In 2018, 52% of students voted on Election Day, while only 40% voted early, and 8% voted absentee.
- Similar to 2016, lower turnout was characteristic of students who were classified as underclassmen, and those in the youngest age groups, compared to their older peers.