Instructions for Maximizing the Potential of an Argos Cube
The Basics
- An Argos Cube is basically very similar to a Pivot Table as used in Excel and other spreadsheet software.
- A cube is used to summarize information and do quick calculations without having to do so with raw data in Excel or other spreadsheet software.
- The magnifying glass icon identifies that there is an Argos Cube built for this data. In addition the name of the Data block will also have the word “Cube” in the title.
b2850490-d6ac-4b37-9c9a-f67e5a0ee665
UTC media

Running the Argos Cube
- To run the Argos Cube double click on the magnifying glass icon or the name of the report you would like to see.
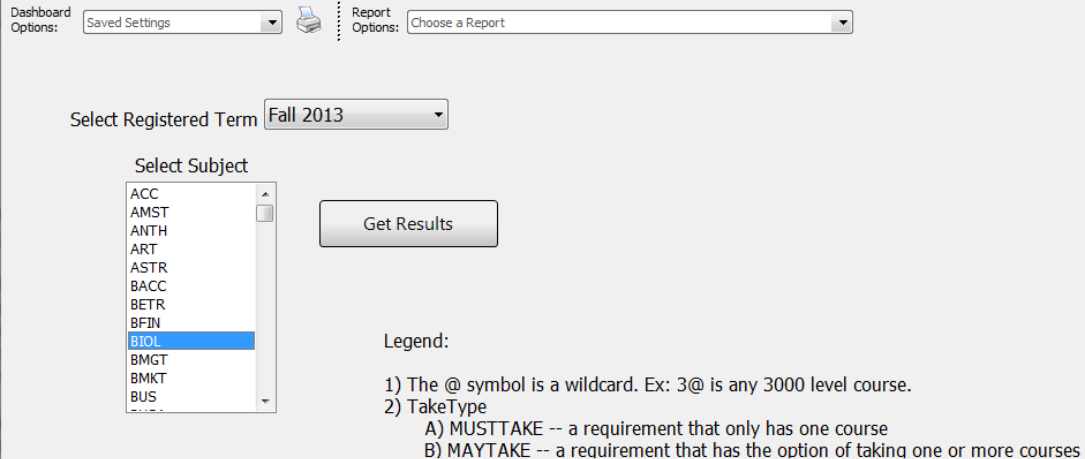
- Dashboard options and Report options at the top can be left blank, but any selection possibilities in the body of the report must be selected to run the data. If multiple options are allowed, a note to the side will indicate how to choose multiple options. In the example below, a Subject and Registration term must be selected. Click on the “Get Data” button, if available, to execute the Argos Cube.
4c1623ec-3f58-4c97-9b76-6aeed9a475f0
UTC media

- Argos Cubes can be manipulated to change the way the data appears, but when it is closed it will revert back to the original format.
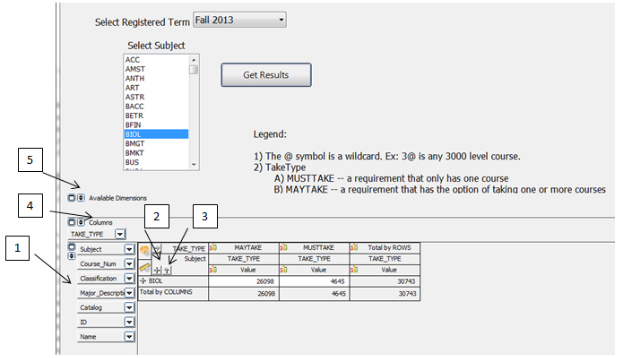
- Below is a screenshot of an Argos Cube with numbers indicating the different parts of the Cube. Each part is then explained below the Cube with reference to the number.
running-the-agros-cube-2
UTC media

- Number 1 - These items listed (Term, Subject, etc...) are available in the report by expanding the cube using the plus sign indicated by the Number 2.
- As the Cube expands, stay on that row and click the additional plus signs that appear over the new data column to continue to expand the cube to show each of the data elements. This allows you to drill down into the different data elements.
- Items in the list of data elements can be rearranged by clicking, holding and dragging the item and moving it to a new spot in the order vertically.
- Be sure to stay in that left hand column or the data may move to an unintended place.
- Number 3 – The arrow indicated by the Number 3 allow for the data in that column to be reordered.
- Number 4 – Any of the data elements listed in Number 1 may be moved to show in the column section by clicking, holding and dragging the item to the column section identified by Number 4.
- Number 5 – The Available Dimensions section allows you to remove any data element form the Cube by clicking, holding and dragging the item to the Available Dimensions area identified by Number 5.
Drilling Down into the Information
agros-drilling-down
UTC media

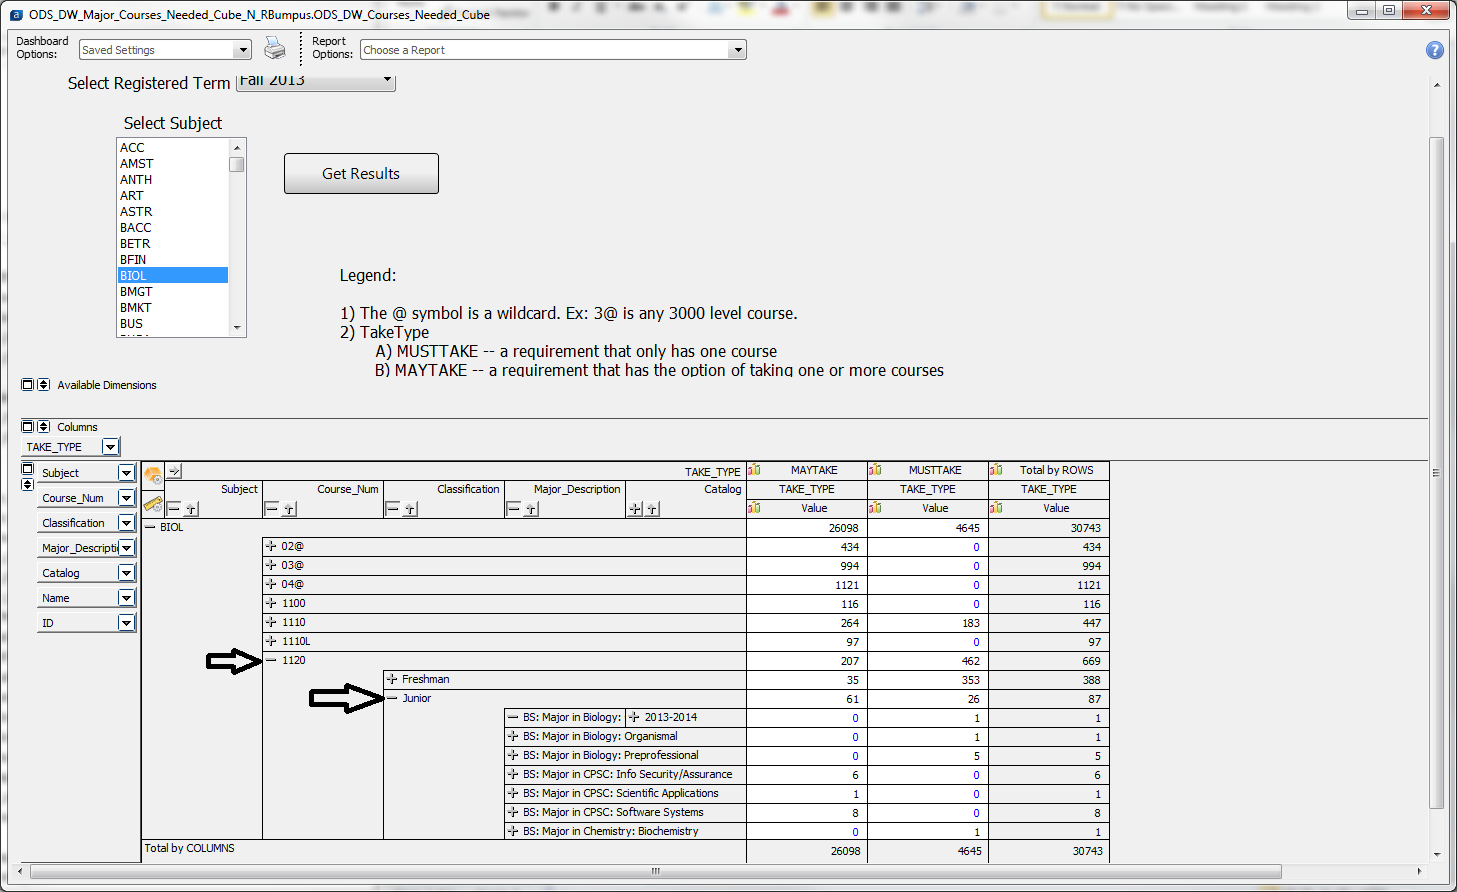
- Single data elements can also be expanded. By selecting the plus sign next to any course number in this example allows you to just expand the data related to that one item.
- At the point that the data is expanded to view the items you are want to see, you may right click anywhere in the Cube and choose the option “Export to Excel (OLE)”. Whatever data elements have been expanded will then be exported to Excel for further manipulation.
- As you expand the data, be sure you have maximized your window to allow for the scroll bars within the Argos Cube to be visible.
- For additional assistance in manipulating an Argos Cube, please contact the our office by emailing us at: [email protected]
- Updated December 2, 2013