Where Have All the Children Gone? The Consequences of Low Fertility Rates in South Korea, Singapore, and Japan
Where Have All the Children Gone? The Consequences of Low Fertility Rates in South Korea, Singapore, and Japan
This complete module with links to all materials may be downloaded as a PDF here.
Michael Robinson
Houston High School
Germantown, Tennessee

Screen capture from âWhen You Came Along" by âHey Baby,â a parenthood initiative by the government of Singapore. Source: YouTube at https://tinyurl.com/ybfj2336.
This module was developed for Tennessee high school world history and geography standard 78ââExplain the challenges of rapid population growth on developing countries and of population decline in developed countries and give examples of policies implemented to both slow and increase population growth.â
The content of the module can easily be adapted for high school courses everywhere that incorporate the content of aging populations and population policies in East and Southeast Asia, specifically Japan, South Korea, and Singapore.
Estimated module length: Five fifty-minute class periods (two days for South Korea, two days for Singapore, and one day for Japan)
Overview
This module will focus on the section of the standard dealing with the challenges of population decline and policies being implanted to increase population growth.
South Korea, Singapore, and Japan have some of the highest life expectancies in the world (Japan is No. 1 at 83.7, Singapore is No. 3 at 83.1, and South Korea is No. 11 at 82.3), as well as some of the lowest fertility rates (number of live births per 1,000 women between the ages of fifteen and forty-four years) in the world (South Korea and Singapore at 1.2 and Japan at 1.5). The combination of low fertility rates and high life expectancies has created unique problems among these three highly developed countries, especially its threat to future economic growth and job growth.
The populations of both Singapore and South Korea continue to grow very slowly. However, it is the sharp decline in fertility rates that have both countries extremely concerned about future population growth. Both countries have developed policies to encourage its population to have more children. The lessons on South Korea will focus on the causes and the immediate and long-term effects of the low fertility rate. The Singapore lessons will also focus on government policies, with specific attention given to Singaporeâs immigration policies to maintain a stable population.
Unlike South Korea and Singapore, Japanâs population already peaked at 127 million in 2010 and is currently at 125 million. The lesson on Japan focuses on the specific issue of how Japan is dealing with a rural population made up of elderly people. Most of the young people who grow up in rural towns move to large urban areas that provide better economic opportunities. The impact on these rural towns has been significant and problematic for Japan.
Objectives
Students will:
List and explain reasons for South Koreaâs and Singaporeâs low fertility rates.
Create and explain population pyramids for both South Korea and Singapore.
Explain and discuss solutions to South Koreaâs and Singaporeâs low fertility rates.
Describe rural life in Japan and discuss the issues facing the elderly population who live in Japanâs rural towns.
Prerequisite knowledge
Assumptions are that students are already able to locate Japan and the Korean peninsula on a map of Asia. It is also assumed students understand the difference between the governments of North Korea (Democratic Peopleâs Republic of Korea) and South Korea (Republic of Korea). This module focuses on South Korea.
It is assumed students have little knowledge on Singapore. Students may or may not be aware that Singapore is an independent country that is referred to as a city-state due to its relatively small size and the fact that all of Singapore is urban. The module will include some basic information on Singaporeâs location, population, and culture.
Module introduction
Click the following links to download the PowerPoint necessary for this guide along with an appendix guide to all of the PowerPoint slides.
The module will use one main website:
Population Pyramids of the World from 1950 to 2100 is a free website showing the age and sex distribution by cohort (age groups) for the worldâs countries. The website also has additional visualizations on a variety of demographic and economic information, eg, carbon emissions, population density, migration, etc.
Class No. 1 will have students create and explain three population pyramid graphs for South Korea. The first graph will be for 1958, because this is the last year in South Korea when the 0â4 cohort (age group) was the highest among all other cohorts. The second graphâs date is 2018 to show the current population distribution in South Korea. The last date for the third and final graph is 2045, because this is the first year South Koreaâs 0Ââ4 cohort is predicted to be below 2.0 percent. After students complete and discuss the graphs, they will view a video on the consequences of South Koreaâs shrinking working population.
Class No. 2 will have students examine photos, read an article, and view two videos on the causes and solutions for South Koreaâs low fertility rates. Students will discuss the validity of selected solutions, and they will create a population poster promoting higher fertility rates in South Korea.
Class No. 3 will provide background information on Singaporeâs location, population, and culture with photos and an article. This information can be optional if students are already knowledgeable on Singapore. Students will view two videos on incentives to increase Singaporeâs fertility rate. Students will use a population interactive website to answer questions about Singaporeâs population issues and potential solutions.
Class No. 4 will have students use www.populationpyramid.net to sketch out six population pyramids for Singapore. The graphs are in twenty-year intervals before and after 2018 in order for students to see how the population has changed over time. Students will complete a writing assignment describing and explaining changes in Singaporeâs population pyramids. Finally, students will read an article on immigration policies in Singapore and discuss how immigration can be part of the solution to Singaporeâs population concerns.
Class No. 5 will have students read a short article and watch a video on elderly life in Japan. The video was developed and produced by the University of Vienna, Austria. It is not a typical video teachers usually show in class since it is a video in German and Japanese with English subtitles. The video showcases the lives of two elderly Japanese citizens living in a rural Japanese town. Students will be made aware of the difficulties they face with shopping, transportation, farming, and staying healthy.
PowerPoint guide
This module includes a comprehensive (169 slides) PowerPoint (Appendix I) that includes handouts, visual images of the websites, videos, student readings, and answer keys. Any reader who would like to see useful graphics related to this module is encouraged to utilize the PowerPoint.
Class No. 1
Estimated time: fifty minutes, excluding the two enrichment activities
Have students create and explain three population pyramid graphs for South Korea. The first graph is 1958, because this is the last year in South Korea when the 0â4 cohort (age group) was the highest among all other cohorts. The second graphâs date is 2018 to show the current population distribution in South Korea. The last date for the third graph is 2045, because this is the first year South Koreaâs 0Ââ4 cohort is predicted to be below 2.0 percent. After students complete and discuss the graphs, they will view a video on the consequences of South Koreaâs shrinking working population.
There is no prework for the lesson. The lesson begins with pictures taken in a rural fishing village located on the southern coast of South Korea.
Bell work activity
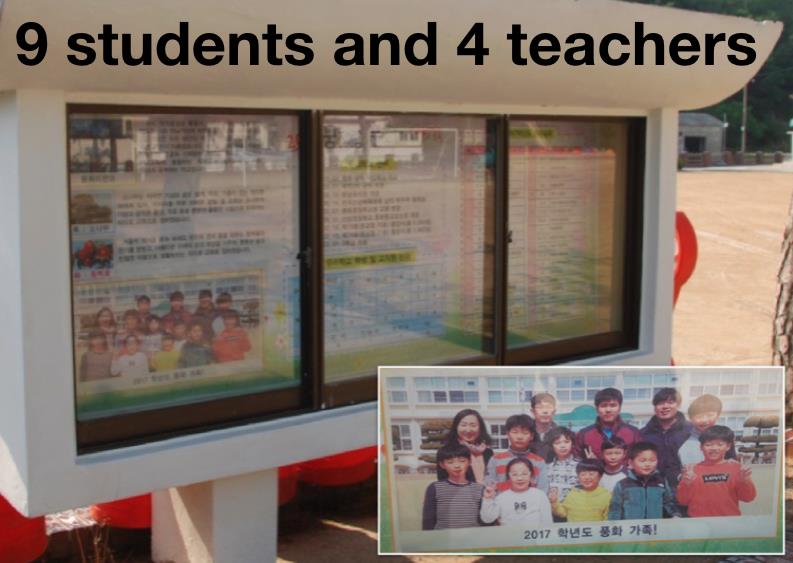
Use slide Nos. 2, 3, and 4 from the PowerPoint to introduce students to Sanyang, a small fishing village in South Korea. The small village and surrounding area has approximately 1,500 residents. Discuss slide No. 5 with your students, then have students write down how many students they think attend the local school. By having all students write down a number, you ensure everyone in the class is participating and thinking about a potential response. Have students share their guesses of how many students attend Sanyang Elementary School.

Slide No. 5 from PowerPoint: View of Sanyang Elementary School from the main street.
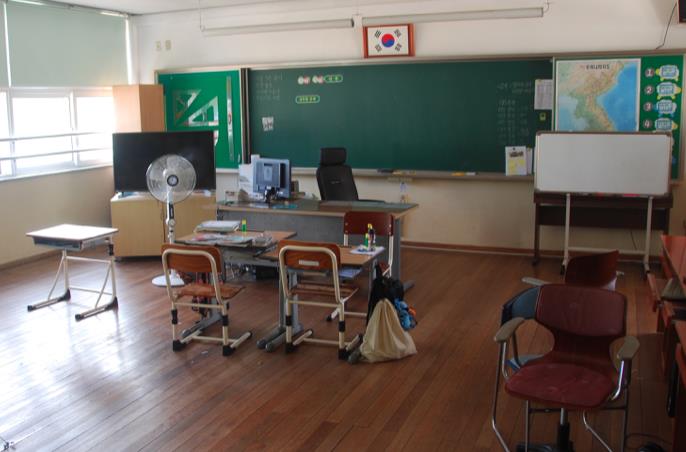
Next, have students view slide No. 6, a typical classroom in the elementary school, and have them guess again how many students are in the school. They will want to guess again because the typical classroom only has two desks.
Slide No. 7 from PowerPoint: School sign with photo of all students and teachers.
Use slide Nos. 8–15 to show students additional photos of the school. Details for each slide are in Appendix I.
Ask students why they think the school only has nine students. Discuss with them the quote below, found on slide No. 16:
“Villages around here have no more children to send,” the school’s only teacher, Lee Sung-kyun, said recently, looking over an empty, weed-filled playground surrounded by old cherry trees. “Young people have all gone to cities to find work and get married there.”
This excerpt is by Cloe Sang-Hun from her New York Times article “As South Korean Villages Empty, More Primary Schools Face Closings,” and it details the reality for many of the small towns and villages across South Korea.
It remains to be seen how long the small elementary school with the nine students can survive and stay open. For many people in South Korea, there is little appealing about a quiet life in an isolated village populated by mostly elderly people. Odds are very good that these nine students will move to larger, more populated urban areas like Busan and Seoul when they finish their schooling.
In some communities of Korea, there are already too few students for a school. The former Daehak Elementary School is shown in slide No. 17, and it closed less than ten years ago. Show students slide Nos. 17–19 to see what might possibly happen to Sanyang Elementary School if it closes. Slide No. 19 shows that the parking area in front of the closed school is now used as a campground for tourists traveling through the area.
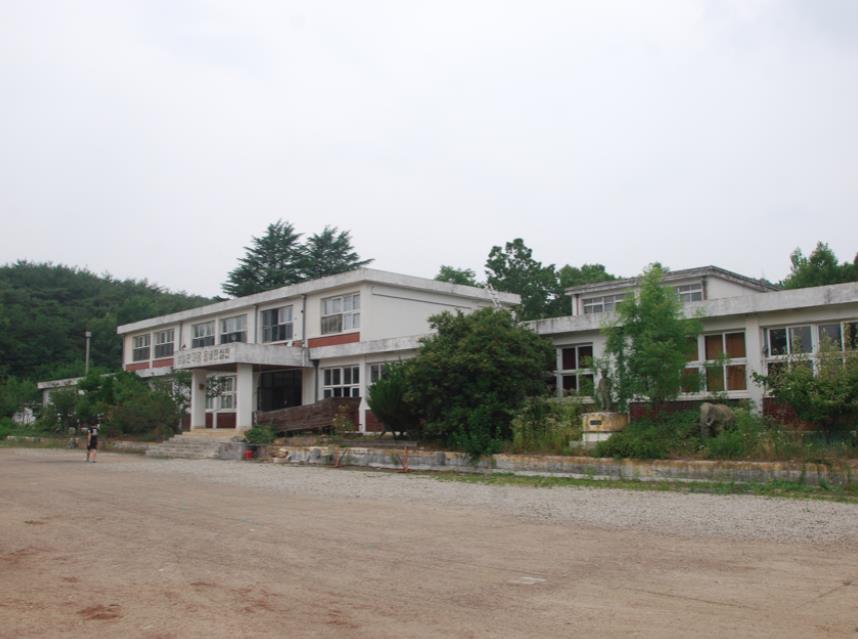
Slide No. 17 from PowerPoint: Former Daehak Elementary School.
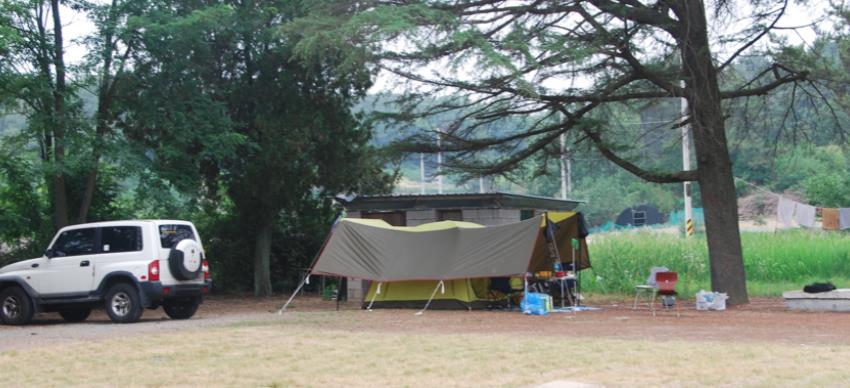
Slide No. 19 from PowerPoint: Campground in front of the former Daehak Elementary School.
Show students slide Nos. 20 and 21 from Yongmoon High School in Seoul. Slide No. 21 is a chalkboard in the principal’s office with the number of classes offered for each year. In grade eleven (the oldest students), there are thirteen total classes; in grade ten, there are twelve total classes; and in grade nine (the youngest students in the school), there are only eleven total classes. Each year, there are fewer and fewer students. Unlike the previous elementary schools discussed, Yongmoon High School is not in danger of closing anytime soon, but the alarm bells should still be sounding, because the demographic issues plaguing rural South Korea are alive and well in the urban areas.
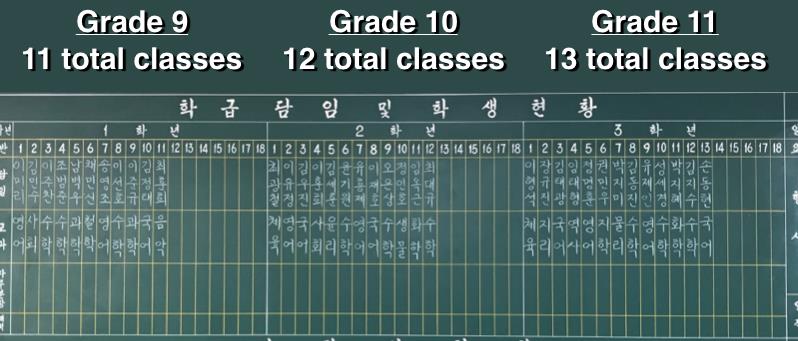
Slide No. 21 from PowerPoint: Principalâs office at Yongmoon High School, Seoul.
Depending on how much time you have for the lesson, you may be able to include these additional photos from slide Nos. 21â25 from Yongmoon High School. If you only have fifty-five minutes or less, you may not have time to share the photos.
Looking into the classrooms at Yongmoon High School during a time when students have a short break, it is not surprising to see many students sleeping (slide Nos. 22 and 23). After learning about the typical day of a student (slide No. 24), it is easy to understand that Korean students are frequently exhausted, overworked, and overstressed. Their job is to study in order to pass their exams so that they can ensure they are granted entrance into a good university.
The excerpt on slide No. 24 is from the BBC article âSouth Koreaâs Schools: Long Days, High Resultsâ by journalist Reeta Chakrabarti. The article documents the day in the life of a teenager in one of Seoulâs affluent neighborhoods of Gangnam:
Hye-Min Park is 16 and lives in the affluent Seoul district of Gangnam, made famous by the pop star Psy. Her day is typical of that of the majority of South Korean teenagers.
She rises at 6.30am, is at school by 8am, finishes at 4pm, (or 5pm if she has a club), then pops back home to eat.
She then takes a bus to her second school shift of the day, at a private crammer or hagwon, where she has lessons from 6pm until 9pm.
She spends another two hours in what she calls self-study back at school, before arriving home after 11pm. She goes to bed at 2am, and rises in the morning at 6:30am to do it all over again.
Instruction for Class No. 1
After the bell work is discussed, the main part of the lessonhow South Koreaâs population has changed over time and illustrate additional consequences and challenges for this population dilemma.
Use slide Nos. 26â33 to review population pyramids with students. This may not be necessary if students are already familiar with population pyramids. If students have a good understanding of population pyramids, you may want to start with slide No. 33 as a short review of what population pyramids can tell us about the history of a country. In this example, students will look at Japanâs 1995 population pyramid.
Next, pass out the handout on South Koreaâs population pyramids in 1958, 2018, and 2045. This is slide No. 34 from the PowerPoint. Use slide No. 35 to review how to construct the population pyramids. If possible, have students color their graphs with one color representing males and another color representing females (in the example, blue is for males and pink/red is for females).
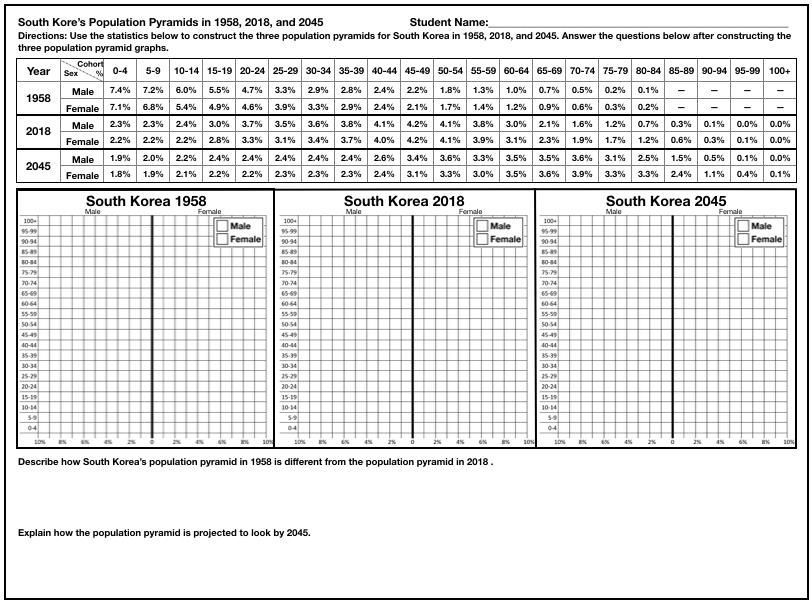
Slide No. 34 from PowerPoint: Student handout on South Korea’s population pyramids in 1958, 2018, and 2045, for constructing population pyramids.
After students have had sufficient time to construct the three graphs and answer the questions below the graphs, show slide No. 36, which shows the completed three graphs and provides prompts for the two discussion questions. To discuss each graph individually, use slide Nos. 37–39.
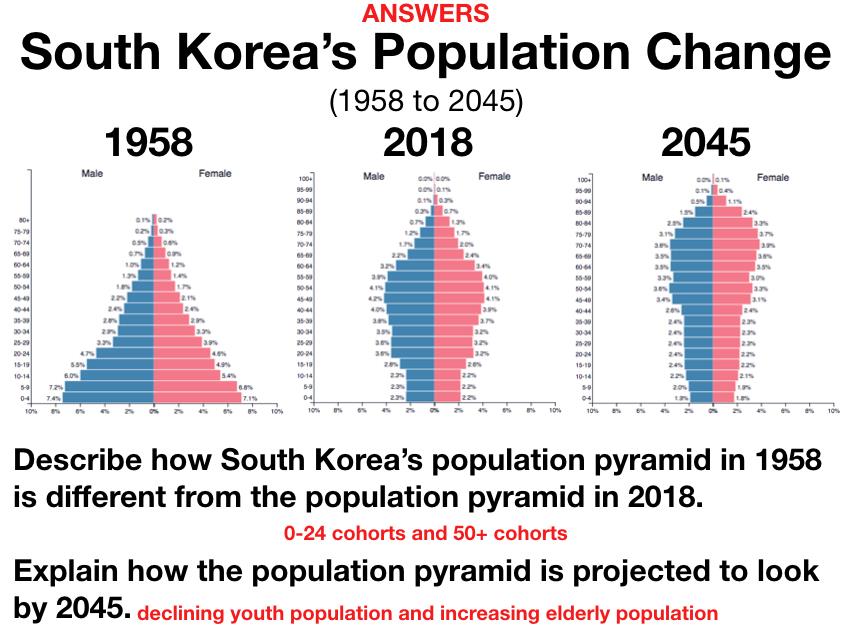
Slide No. 36 from PowerPoint: Answers to student handout on South Korea’s population pyramids in 1958, 2018, and 2045.
Final activity for Class No. 1
Have students view the video “Korea’s Working Population Shrinking Fast” (two minutes, three seconds). As students view the video, have them answer the questions below. mplete Class No 1’s lesson by reviewing the answers to each of the questions below with your students.
How does South Korea’s fertility rate compare to other countries in the world?
What is happening to South Korea’s working-class population?
Describe how South Korea’s demographics are projected to change between 2017 and 2037 for twenty- to fifty-year-olds and those over sixty.
What are the consequences of a declining working-class population?
Explain how the term “demographic time bomb” relates to South Korea.
Enrichment activity
If time allows for a more thorough discussion on declining fertility rates in South Korea, you can use the following resources on slide Nos. 43 and 44 to have a discussion on the impact of high youth unemployment on South Korea’s declining fertility rates
Have students read and briefly discuss the writing prompt below, and then
listen to “South Korean Youth Struggle to Find Jobs After Years of Studying for Tests” (three minutes, fifty-five seconds). Once they have completed this, have them complete the writing prompt below.
Writing prompt: One issue that contributes to the low fertility rate is the recent problem of high youth unemployment. Many college graduates are unable to find employment in the large conglomerates in South Korea, and as a result of their not being able to find their “dream jobs,” many delay marriage and having a family due to not being financially stable. Discuss possible solutions to this issue in South Korea.
Class No. 2
Estimated time: fifty minutes
Have students examine photos, read an article, and view two videos on the causes and solutions for South Korea’s low fertility rates. Students then discuss the validity of selected solutions, and create a population poster promoting higher fertility rates in South Korea.
Class No. 2 builds upon the first lesson, with students learning specific examples of what the South Korean government is doing to promote higher fertility rates among its citizens.
Bell work activity
Begin the lesson by showing students the question on slide No. 47. Before having students answer, show them the photos on slide Nos. 48–51. The answer to the question is rice.

Slide No. 47 from PowerPoint: Rice field in South Korea.
From the bell work during Class No. 1, students learned that the population of rural towns in South Korea was in decline and predominantly elderly. Ask students what concerns the South Korean government might have regarding the relationship of rice farming to declining fertility rates. A clue to the answer is in the bell work question—“harvested.” (Answer: In the near future, there may not be enough farmers to grow and harvest rice.) Next, show students slide No. 52 of a GPS automated tractor. Ask students what is unusual about the tractor. They will notice a camera where the farmer should be sitting. It is a prototype of an unmanned tractor that potentially could be used in the future in South Korea’s agricultural fields. This is one example of a potential solution if South Korea cannot increase its fertility rate to ensure there will be enough agricultural workers in the future.

Slide No. 52 from PowerPoint: Prototype for a GPS automated tractor.
Instruction for Class No. 2
Students next complete a brainstorming activity with the following prompt: âWrite down as many solutions you can think of that South Koreaâs government might implement to help increase its low fertility rates.â Once students havewo to three minutes to write down their responses, they can share their ideas in groups of four. After each group has three minutes to discuss all responses, have a class discussion where each group shares its top ideas.
After the brainstorming activity, ask students to explain how slide Nos. 54â60 can help contribute to making South Korea a friendlier country for women who are pregnant.
Answer: In South Korea, there are subtle details one sees when traveling through the country, including reserved seating for pregnant women on the subway, bathrooms for pregnant women only, and the best parking spaces are sometimes reserved for pregnant women. Additional details for slide Nos. 54â60 are found in Appendix I.
The next activity is to have students watch the short (five minutes, forty-eight seconds) video from YouTube called âKoreaâs Ultra-Low Birth Rate: Causes and Solutionsâ and answer the questions below (also in the PowerPoint).
What is a âdemographic cliffâ?
What has happened to South Koreaâs fertility rate? How does it compare to other countries around the world? Developed countries?
What were the three parts of the master plan to increase fertility?
What are the criticisms of the government policies to increase fertility rates?
Why did the mother return to work after the birth of her child?
Discuss how work life in South Korea negatively impacts the fertility rate.
What can be done to improve a workâlife balance?
How does job security impact fertility rates in South Korea?
Why is improving the low fertility rate important to South Koreaâs economy?
From the video, what do you believe is the best solution to help increase the low fertility rate?
Additional article and video (for classes longer than fifty minutes)
After discussing the answers to the questions from âKoreaâs Ultra-Low Birth Rate: Cause and Solutions,â have students read the article âKorea Prepares Emergency Measures to Bolster Birthrateâ and watch the video "South Koreaâs Declining Birth Rateâ (three minutes, thirty-eight seconds), and answer the questions that follow.
What are state subsidies? List an example.
What has happened to the number of newborns in South Korea?
Describe paternity leave measures.
What are the benefits for couples who have three or more children?
What can business leaders do to help encourage couples to have children?
âSouth Koreaâs Declining Birth Rateâ questions
What concerns do many women have about having children?
What is South Koreaâs âbirth strikeâ? Why is it occurring?
List three obstacles facing South Korean women that contribute to not having children.
How do some âtraditionalistsâ react to many womenâs reluctance to have children?
How much money has the South Korean government spent over the past ten years to boost the fertility rate?
What reason does Yoon Kim give as to why women are not having children?
How is making âmen part of the solutionâ a good move by the South Korean government?
Why was the Adeulbawi Rock (Son Rock) used as an example in the video?
Final discussion and activity for Class No. 2
In the final class discussion and activity on solutions to South Koreaâs declining fertility rates, students complete the first part of the handout on potential solutions to low fertility rates. Have students work in groups of four to complete the handout. Once students have completed the first part, including the two questions at the bottom of the page, discuss their answers in class.
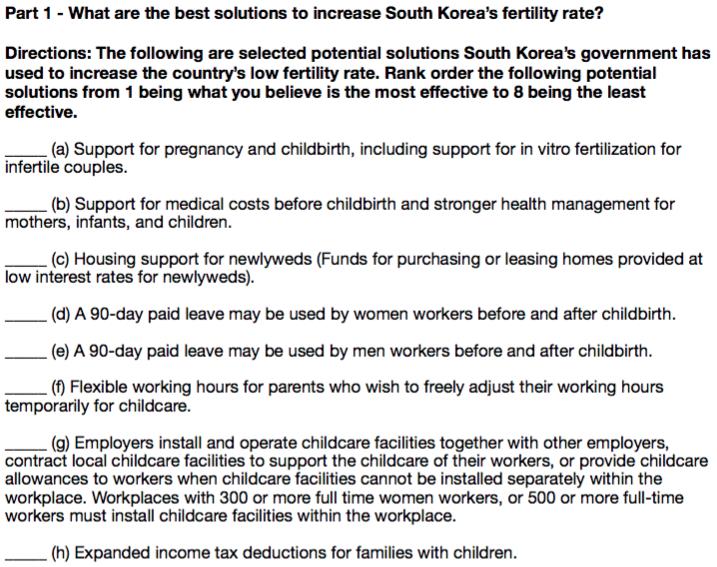
Slide No. 70 from PowerPoint: What are the best solutions to increase South Korea’s fertility rate?
Author’s notes on students’ reactions
There will probably not be one answer the majority of students agree on as the most important. The most common answers students cited in my class were: (f) flexible working hours, (g) employers install and operate child care facilities, and (h) expanded income tax deductions for families with children. During class discussion, students debated the need for young parents to have more time and/or more money. One student’s comment was, “Women are career-driven, and having child care near their work would definitely make life easier.” Another student commented, “Kids are expensive, and that is why both my parents are working. It is the same in Korea with needing dual incomes.” The solution that had the least support among students was clearly (e) a ninety-day paid leave for men. Most students felt that it was important, but they also felt that all the other solutions would be more helpful. A second response that was near the bottom of most students’ lists was (a) support for pregnancy and childbirth, including support to in vitro. The main comment from students was that this was important, but they felt that it was limited in how many people it would actually support. This led to a discussion about the age women in South Korea typically start a family (thirty years old), and since it is later than in many other countries, students understood why this solution may be more relevant than they initially thought.
The homework for Class No. 2’s lesson is for students to complete the second part of the handout on potential solutions to low fertility rates. Students will follow the criteria listed to create a population poster promoting higher fertility rates in South Korea or in additional Asian countries with dangerously low fertility rates.
Criteria for population poster
The poster should reflect the current population concerns for one of the following: Japan, Singapore, South Korea, or Taiwan.
The poster should have a minimum of one photo and text explaining the photo.
The poster should be a pro-natal poster, meaning it is promoting an increase in the total number of births.
The poster should include text large enough to read and limited in amount as to not overwhelm the reader. (See examples to better explain.)
Provide sources and your name on the back of the poster.
Show students the three student examples from slide No. 72. Discuss whether these examples follow the criteria outlined. (All three student examples have too much text for the poster, and in the first two examples, the text is too small to read.) Then, show students the example on slide No. 74, which does fit all the criteria.
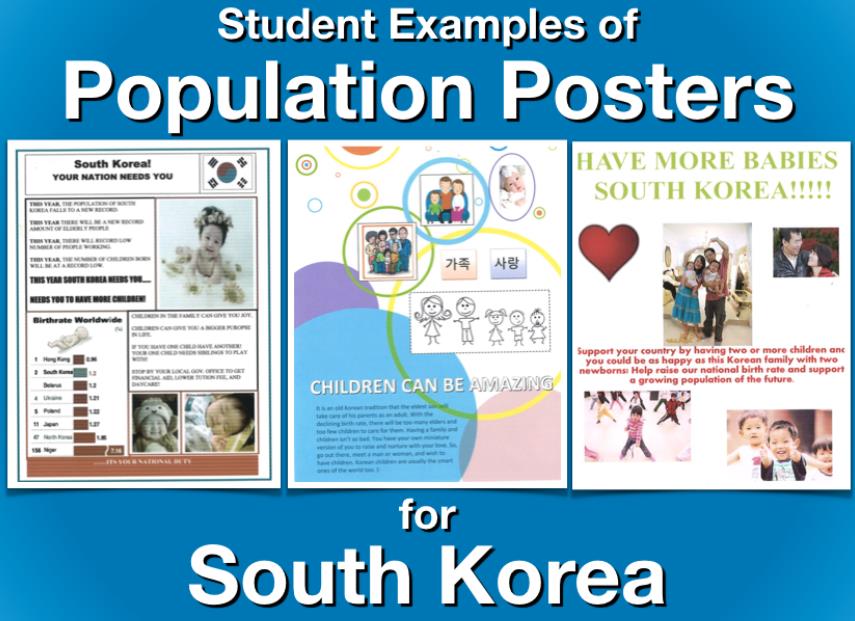
Slide No. 72 from PowerPoint: Student examples of population posters for South Korea.
Author’s notes on students’ reactions
When I introduce the poster, I ask students to tell me what they think makes an effective poster. We then discuss the examples in the PowerPoint and how much text should or should not be on the poster. I stress to students that the main purpose of the poster is to persuade someone to read the poster and believe what they read on the poster. I do not show many examples because I have learned if I show six to eight examples, several students will create similar posters. I want students to be creative and thoughtful when developing their poster, and I do not want them to copy someone else’s ideas. Students enjoy creating the poster and sharing it with the class. I have them share their posters in small groups and pick at least one in their group to share with the entire class. I also will put the best posters on my wall in my classroom.
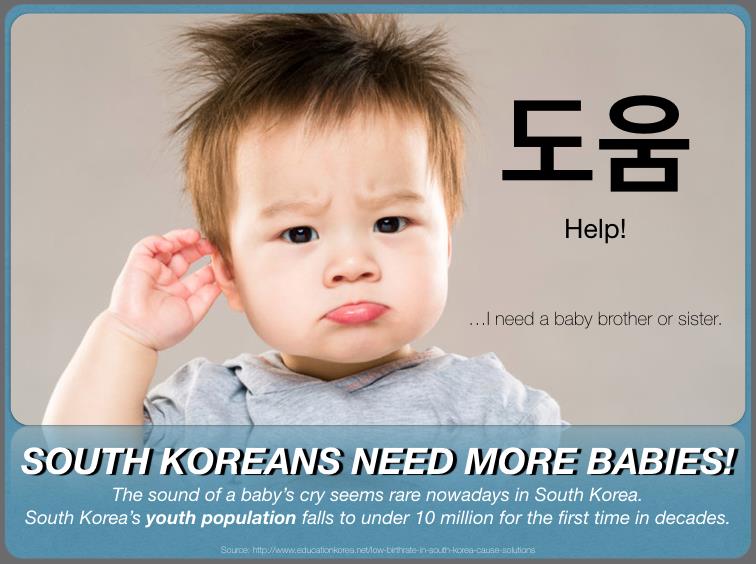
Slide No. 74 from PowerPoint: Student example of an acceptable population poster for South Korea.
Class No. 3
Estimated time: fifty minutes, not including optional activity
Class No. 3 provides background information on Singapore’s location, population, and culture with photos and a related article. This information can be optional if students are already knowledgeable of Singapore. Students view two videos on incentives to increase Singapore’s fertility rate. Students use a population interactive website to answer questions about Singapore’s population issues and potential solutions.
Class Nos. 3 and 4 are not dependent on the information learned in Class Nos. 1 and 2. The lessons for Class Nos. 3 and 4 focus on Singapore’s efforts to increase its fertility rates and maintain a stable working population.
Bell work activity
Show students slide No. 76 with the question, “After viewing the following slides, how would you describe life in Singapore: culture, housing, religion, food, and language?” Then, go through slide Nos. 77–90. These slides provide students with examples of Singapore’s culture, housing, religion, food, and language. Details for each slide are included in Appendix I. After viewing all the slides, go over the examples on slide No. 91.

Side No. 76 from PowerPoint: Bell work question for Class No. 3.

Slide No. 91 from PowerPoint: Possible answers for examples of life in Singapore.
Optional article activity for Singapore
If you want students to know more about Singapore, have them complete the summary notes for the Education About Asia article “Top Ten Things to Know about Singapore in the Twenty-First Century.”
Write two- to three-sentence summaries for each of the ten things to know about Singapore:
Many names of Singapore
Britain’s crown colony to “unsinkable” fortress
Internal independence, the Malay Federation, and national independence
From mudflats to metropolis
Third world to first
Total defense
Regardless of race, language, or religion
Confucian meritocracy
An ideology of pragmatism
Odd honest kid on the block
Instruction for Class No. 3
Have students view two Singapore commercials on encouraging couples to have more children. After viewing both videos from YouTube, have students discuss the purpose for each commercial and the effectiveness of each commercial.
The commercials are “When You Came Along” and “Times May Have Changed But the Joy of Parenthood Remains.”
After discussing the two commercials, have students watch and answer the questions for “Singapore’s Population Growth Incentives” (three minutes, forty-five seconds). The video provides students details on what efforts Singapore has gone through to increase its low fertility rates.
When did Singapore last achieve its fertility replacement level of 2.1?
What are the effects of low population growth for Singapore?
What has the government done to try to increase the birthrate? List four examples.
Have these government policies been effective?
What impact does work have on the low birthrates?
What is one way that Singaporeans might achieve a work–life balance?
The final video for students to view and answer questions for is titled “On How Singapore Is Increasing Its Birth Rate” (three minutes, eight seconds) This short YouTube video is an interview in which Singapore’s prime minister discusses the importance of immigration in helping solve Singapore’s population concerns.
What does Prime Minister Lee Hsien Loong say about Singapore’s birthrate?
According to the prime minister, what are some things Singapore can do to improve its birthrate?
How does the prime minister describe the populations of cities?
What does the prime minister say about “outside talent”?
What is the “balance” to which the prime minister is referring at the end of the video?
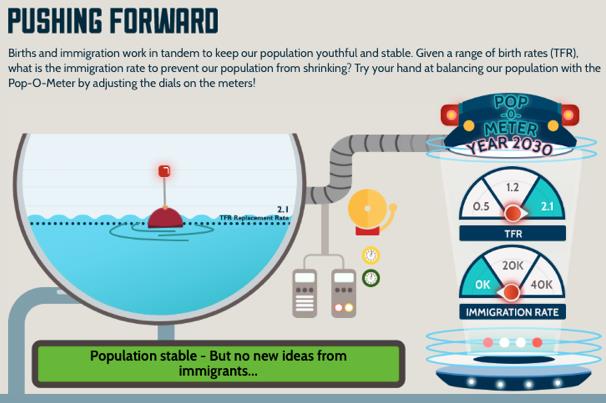
Slide No. 126 from PowerPoint: Stabilizing Singapore’s population.
Class No. 4
Estimated time: fifty minutes
Class No. 4: Students use www.populationpyramid.net to sketch six population pyramids for Singapore. The graphs are in twenty-year intervals before and after 2018 in order for students to see how the population has changed over time. Students complete a writing assignment describing and explaining changes in Singapore’s population pyramids and then read an article on immigration policies in Singapore and discuss how immigration can be part of the solution to Singapore’s population concerns. Class No. 4 is a continuation of what students learned in Class No. 3.
Author’s notes on students’ reactions
Once students have been given the website address, they find it very easy to answer the questions. This activity does not require a great deal of instructions. I show students the website, and I briefly go over each part of the website. Students are usually very quiet when working on the assignment because they find the website interesting and easy to navigate. When I asked students to tell me what they thought of the website after they had completed the questions, the most common words were “cool” and “fun.” Students like that the website is interactive and engaging.
Bell work activity
Begin Class No. 4 by showing students the three advertisements on slide No. 128. Ask students to explain the purpose of each poster. Ask the following question, “Was the purpose of the posters for Singapore to encourage its citizens to lower its fertility rates or increase them?” The simple answer is that Singapore’s fertility rate was higher prior to 1990, and the government wanted couples to have fewer children.
“The second can wait,” “Put some years between us,” and “One, two and that’s ideal” posters are all three designed to keep Singapore couples from having more than two children. Also, if couples were to have more than one child, the government wanted the couple to wait several years before having the second child.
Have students compare and contrast these advertisements to the commercials from Class No. 3 that were produced after 2010 encouraging couples to have a second child.
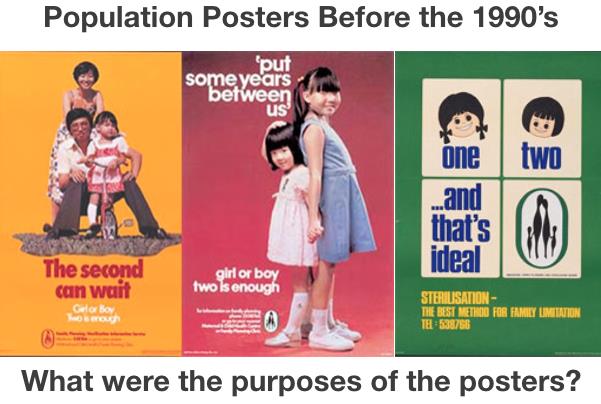
Slide No. 128 from PowerPoint: Advertisement posters prior to 1990.
Instruction for Class No. 4 (not including the optional activity)
Optional activity
If you want students to construct population pyramids similar to the ones in Class No. 1âs lesson, have them access the website Population Pyramid to find the percentages for each cohort in order to construct the graphs on the Singaporeâs changing population pyramids, 1958â2058 handout. The directions for constructing the population pyramids are on slide Nos. 129â133, and the handout is found on slide No. 134.
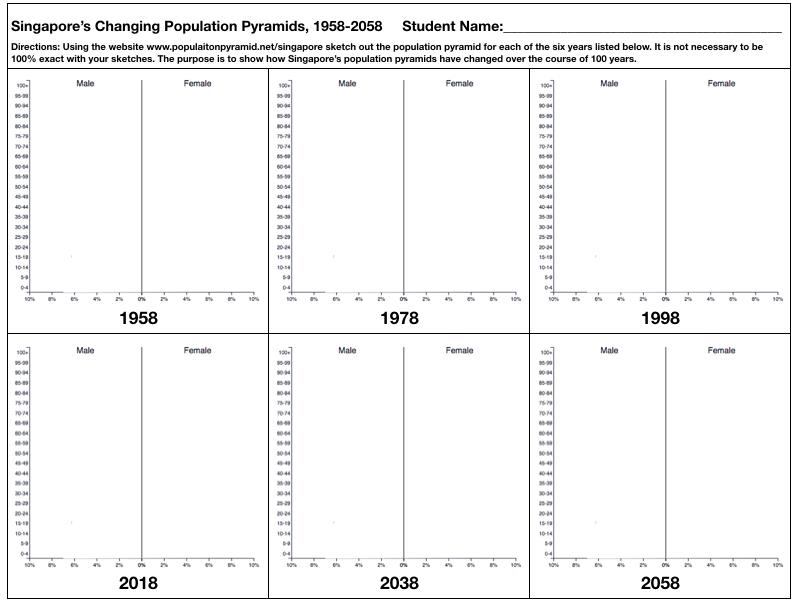
Slide No. 134 from PowerPoint: Singapore’s changing population pyramids, 1958–2058 handout.
If you do not want to have students construct the population pyramids, start the lesson with slide No. 136, which contains the answers to the handout. Have students view the six population pyramids, and then have them answer the questions on slide No. 136: How has Singapore’s population changed from 1958 to 2018? Why have these changes occurred? How is Singapore’s population projected to change from 2018 to 2058? Discuss the consequences for these changes.
After discussing with students how Singapore’s population has changed, have them read the winter 2017 Education About Asia article “Singapore: Immigration and Changing Public Policies.” The article will require students a minimum of twenty-five minutes to complete. Have students answer the questions below as they read the article. Once students have had time to complete the questions, review their answers at the end of class or at the beginning of the following class.
What is Singapore’s history as it relates to immigration?
Describe the ethnic diversity found in Singapore.
Compare immigration in Singapore to countries like the United States, Canada, or Australia. How has it been different?
Since the 1990s, what type of immigrants has Singapore encouraged?
Describe the immigrants who are the “foreign talents.”
What was the catalyst for the Foreign Talent Policy?
How did Singapore go about attracting foreign talents?
Describe the immigrants who are the “foreign workers.”
What are the social and economic impacts of having a high number of foreign worker immigrants?
Describe five types of work done by the foreign workers.
Discuss how the foreign talents are treated differently than the foreign workers.
What are the attitudes toward immigrants in Singapore?
Explain what is meant by “Singapore for Singaporeans.”
Why did Prime Minister Lee Hsien Loong single out national identity as a factor in slowing the inflow of immigrants?
What has been the lasting impact of the communal riots in 1969?
How important are immigrants to Singapore’s economic success?
Explain the last sentence of the article.
Explain the title of the article. What are the changing public policies?
Class No. 5
Estimated time: fifty minutes
Class No. 5: Students read a short article and watch a video developed and produced by the University of Vienna, Austria. The documentary is not the typical video teachers usually show since it is in German and Japanese with English subtitles. The film showcases the lives of two elderly Japanese citizens living in a rural Japanese town. Students will be made aware of the difficulties they face with shopping, transportation, farming, and staying healthy.
Bell work activity
Have students view the photo on slide No. 146 with the question, “What are the people doing in the photo?” (Answer: Learning to play the harmonica.) Ask students the next question, “What do the people have in common?” (Answer: They are all elderly.) Ask students the final question, “Why are elderly people learning to play the harmonica?” (Answer: Classes like the one in the photo are common in Japan as a way to keep the elderly active.)
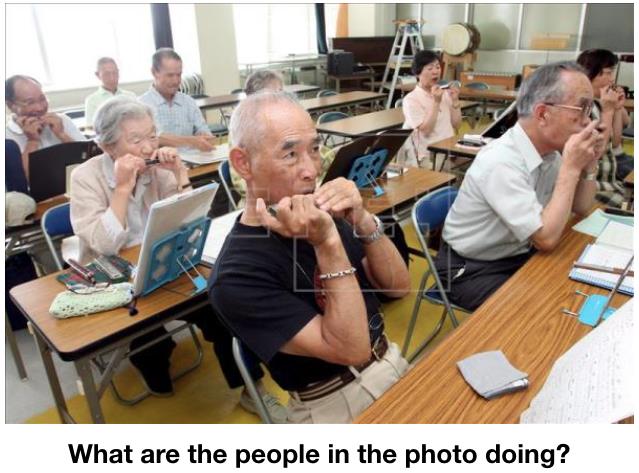
Slide No. 146 from PowerPoint: What are the people in the photo doing?
Instruction for Class No. 5 (not including optional article)
Optional article
If time allows, you can have students read the article that accompanies the photo in slide No. 146: âJapan to Accept More Foreigners as Caregivers for the Elderly.â When they read the article, students can answer the questions below.
Why is the Japanese Ministry of Health, Labor, and Welfare preparing to increase the number of foreign caregivers? Where will the caregivers come from?
What is the future outlook for the number of laborers in this sector?
Discuss issues with how some of the foreign workers have been treated.
Have students view the YouTube video âBeing Old in Rural Japanâ (thirty-five minutes, eight seconds) and answer the questions from the handout. The video will take longer than thirty-five minutes to view because it is in German with English subtitles.
Students will not be able to answer the questions and view the video at the same time. It is recommended that you stop the video and allow students time to answer the questions after each of the twelve divided time sections from the video on the handout. There is at least one question for each of the twelve sections for students to answer.
Viewing warning: Students have limited experience watching subtitled videos, and it may be necessary to stop more frequently.
Part 1 (0:00â4:00): Introduction
Why are there few young people in the rural villages? Describe who lives in the villages.
Part 2 (4:01â8:47): Kikuchi Genichi, 93
Describe his poetry.
Part 3 (8:48â11:13): Nishizawa Shimako, 84
What did the three women discuss?
Part 4 (11:14â12:38): âActive agingâ
What is âactive agingâ?
Part 5 (12:39â13:43): Kikuchi Genichi, 93
How does he describe his life?
Part 6 (13:44â15:40): Life in the village/food
Explain the importance of the bus. Why is its future threatened? In what ways do the villagers purchase food?
Part 7 (15:41Ââ17:37): Driving (Kikuchi Genichi)
What do the elderly have to do to obtain a license to drive? How do others know the driver is over seventy-five? When Kikuchi Genichi is driving around the village, what information does he give about the village?
Part 8 (17:38â19:07): Agriculture
Describe what is grown in the village. Describe the type of farming done by more of the elderly.
Part 9 (19:08â24:47): Children/farming
When do some of the children of the elderly come to visit? Describe Nishizawa Shimakoâs farming.
Part 10 (24:48â27:03): Shopping
How has shopping changed in the villages?
Part 11 (27:04â30:18): Gateball/leisure time/âsenior citizens associationâ
Describe gateball. How important is it to some of the villagers? List four examples of things the elderly do in their leisure time.
Part 12 (30:19â33:24): Municipality/community center
Describe three activities supported by the municipality and conducted at the community center.
Summary questions
How would you describe elderly life in rural Japan? What are the future concerns for the elderly living in rural Japan?
Authorâs notes on studentsâ reactions
Showing a subtitled video requires prepping students for what they need to do while watching the video. I tell them their only job is to watch the video and read the subtitles. They do not need to be writing anything down while the video is playing, because they do not speak Japanese or German (or at least none of my students do). I tell them the only time they need to be writing on the handout is when I stop the video to discuss the different sections on the handout. This particular video is relatively easy for students to keep up with the subtitles. Students did find the first part of the video, when the gentleman is talking about poetry, to be somewhat boring. However, they were very much interested when he started driving through the town and going shopping. Another highlight for students was seeing men and women play gateball. Gateball is a game similar to and inspired by croquet. The reactions from students after watching the video were wide-ranging. The most common negative response from students was that they didnât like having to read the subtitles. However, most students were positive toward the video because it showed them a way of life they had never seen before. Some students compared it to visiting their grandparents in rural Tennessee and Mississippi.
Optional article:
If time allows, teachers can have students read the article that accompanies the photo in slide No. 146: âJapan to Accept More Foreigners as Caregivers for the Elderly. âWhen they read the article, students can answer the questions below.
Why is the Japanese Ministry of Health, Labor, and Welfare preparing to increase the number of foreign caregivers? Where will the caregivers come from?
What is the future outlook for the number of laborers in this sector?
Discuss issues with how some of the foreign workers have been treated.
References and resources
https://www.asianstudies.org/publications/eaa/archives/top-ten-things-to-know-about-singapore-in-the-twenty-first-century/: This is a link to Charles Chao Rong Phua, âTop Ten Things to Know About Singapore,â Education About Asia 22, no. 2 (2017): 62â64.
https://www.asianstudies.org/publications/eaa/archives/singapore-immigration-and-changing-public-policies/:This is a link to Chris Hudson, âSingapore: Immigration and Changing Public Policies,â Education About Asia 22, no. 3 (2017): 36â39.
http://www.bbc.com/news/education-25187993: This is a link to Reeta Chakrabarti, âSouth Korea's Schools: Long Days, High Results,â BBC, December 2, 2013.
https://www.efe.com/efe/english/life/japan-to-accept-more-foreigners-as-caregivers-for-the-elderly/50000263-2521136: This Agencia EFE article is called âJapan to Accept More Foreigners as Caregivers for the Elderly,â January 27, 2015.
https://www.koreaexpose.com/the-end-of-south-koreas-rural-schools/: This is a link to Karl Schutz, âThe End of South Koreaâs Rural Schools,â Korea Expose, March 27, 2015.
http://www.koreaherald.com/view.php?ud=20160825000693: This link is for âKorea Prepares Emergency Measures to Bolster Birthrate,â Korea Herald, August 25, 2016.
http://www.maphill.com/singapore/location-maps/political-map/: This site provides a political location map of Singapore.
https://www.nytimes.com/2015/08/10/world/asia/as-south-korean-villages-empty-more-primary-schools-face-closure.html: This is the link to Choe Sang-Hun, âAs South Korean Villages Empty, More Primary Schools Face Closings,âThe New York Times, August 9, 2015.
https://www.populationpyramid.net: This site has population pyramids of the world from 1950 to 2100.
https://www.youtube.com/watch?v=32GTZ6-bUZM: This is the link to âSouth Koreaâs Declining Birth Rateâ by the Canadian Broadcasting Corporation (CBC) on YouTube.
https://www.youtube.com/watch?v=4yfbzFyqt_8: This is the link to âWhen You Came Along" by âHey Baby,âa parenthood initiative by the government of Singapore on YouTube.
https://www.youtube.com/watch?v=6vCthCecq-0: This is the link to â[4 Angles] Korea's Ultra-Low Birth Rate: Causes and Solutionsâ by Arirang Issue, February 19, 2018, YouTube.
https://www.youtube.com/watch?v=GDyPwiVObzg: â65+ Being Old in Rural Japanâ is an Austrian documentary by Pia Kieninger and Isabelle Prochaska-Meyer. It was posted by user âhenroboke,â June 17, 2016, YouTube.
https://www.youtube.com/watch?v=joSuXGzg8c0: This is a link to âKorea's Working Population Shrinking Fastâ by Arirang News, January 2, 2018, YouTube.
https://www.youtube.com/watch?v=NRhg-oDbz18: This is a link to âSingapore's Population Growth Incentivesâ by Inconvenient Questions, March 23, 2016, YouTube.
https://www.youtube.com/watch?v=pGWp8dFxNSQ: This is a link to âOn How Singapore Is Increasing Its Birth Rate (LKY Prize Award Ceremony)â by the Prime Ministerâs Office, Singapore, July 11, 2016, YouTube.
https://www.youtube.com/watch?v=tMlBMjaijdE: This is a link to âTimes May Have Changed But the Joy of Parenthood Remainsâ by I Love Children, a Singaporean organization promoting childbirth and well-being.
https://www.npr.org/sections/parallels/2017/05/28/530153288/south-korean-youth-struggle-to-find-jobs-after-years-of-studying-for-tests:This is a link to âSouth Korean Youth Struggle to Find Jobs After Years of Studying for Tests,â from National Public Radio (NPR).